EPSS Score Mechanics: How Probability Drives Patch Prioritisation
The Exploit Prediction Scoring System predicts the likelihood of real-world exploitation, allowing teams to ignore high-CVE scores that rarely face active attacks.

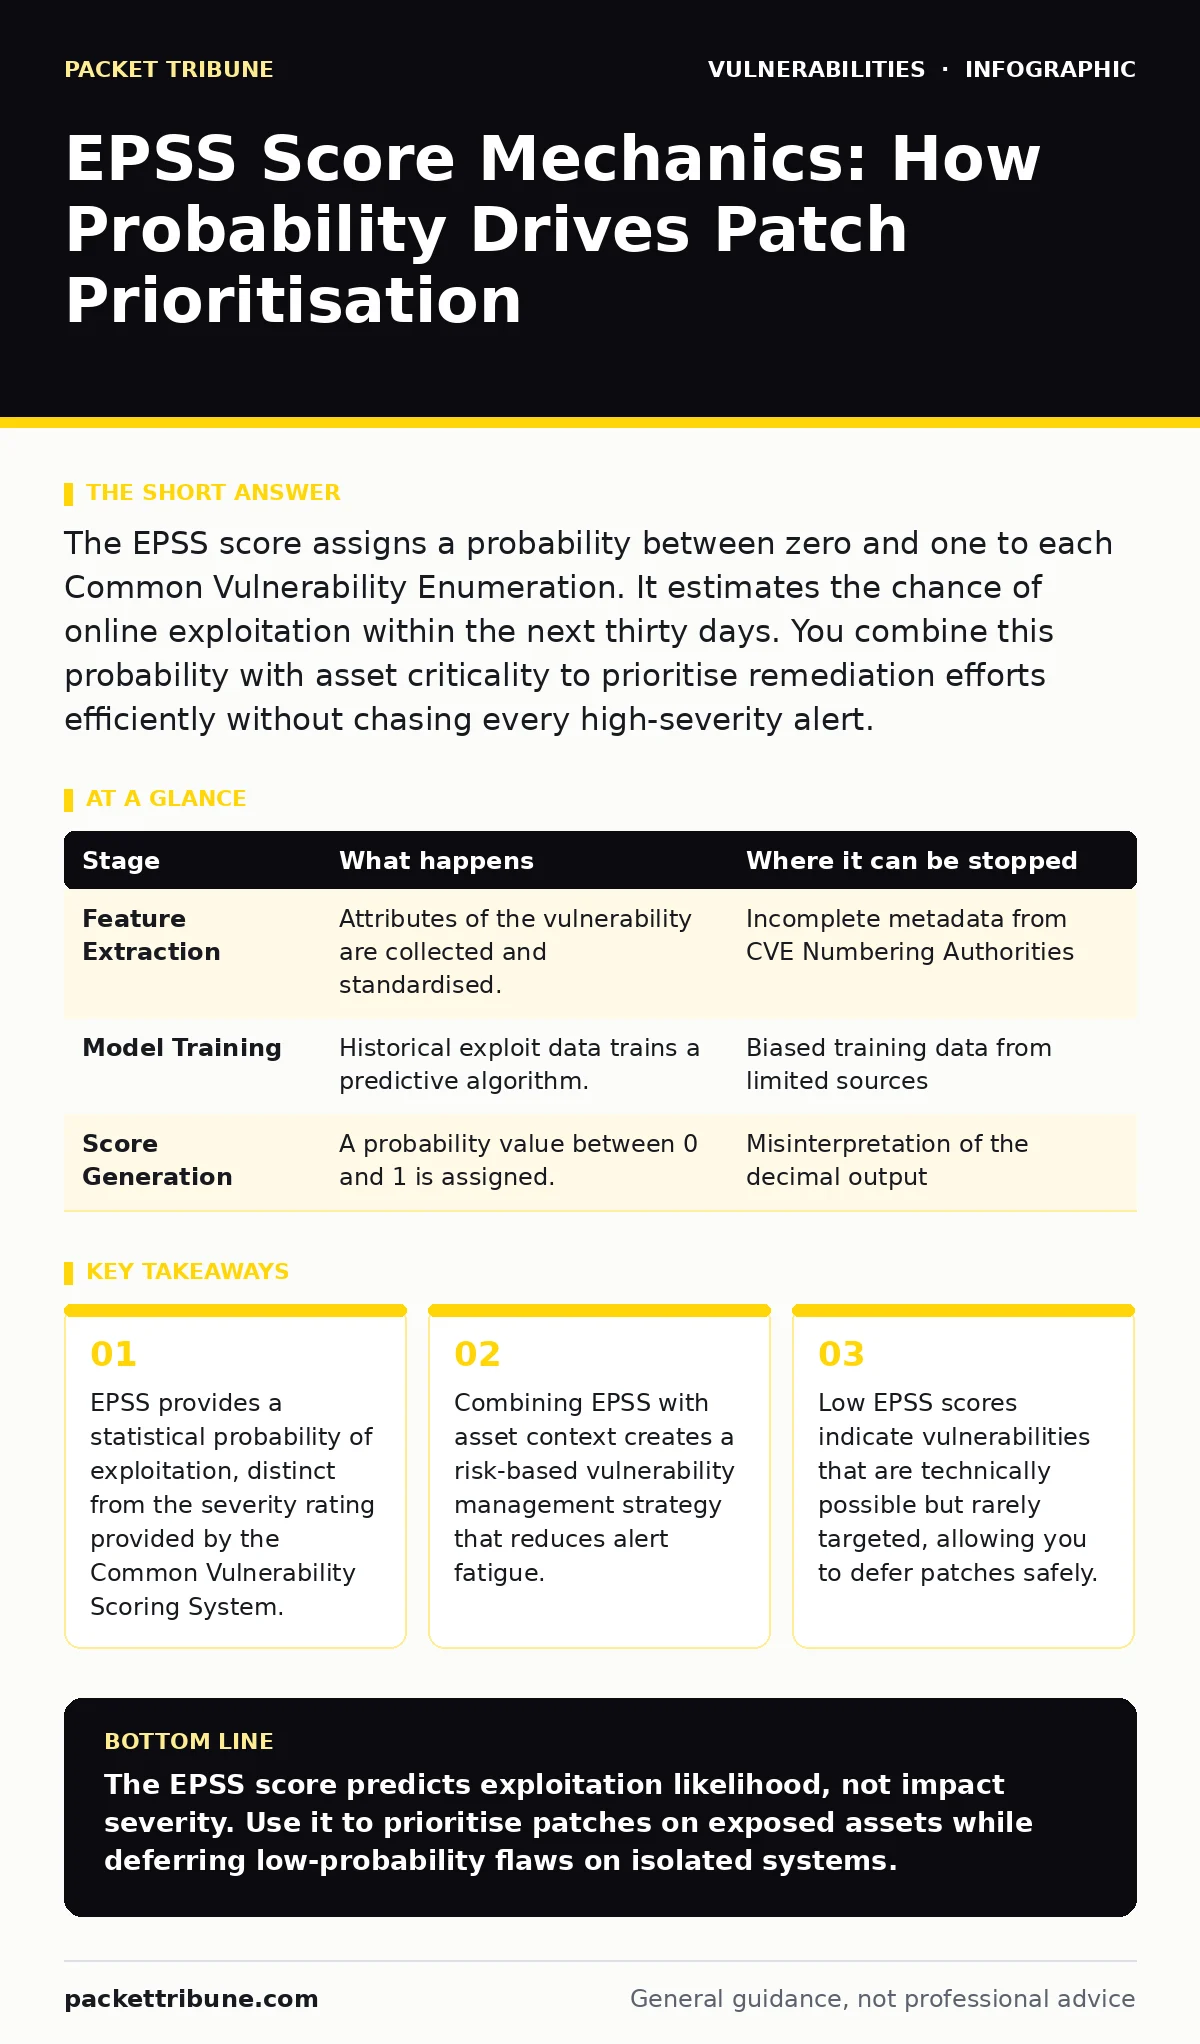
The EPSS score assigns a probability between zero and one to each Common Vulnerability Enumeration. It estimates the chance of online exploitation within the next thirty days. You combine this probability with asset criticality to prioritise remediation efforts efficiently without chasing every high-severity alert.
Understanding the Probability Model
The Exploit Prediction Scoring System measures the likelihood that a specific vulnerability will be exploited in the wild. It does not measure how bad the impact would be. It measures whether an attacker is likely to try. This distinction separates theoretical risk from practical threat. You use this data to decide which patches to apply immediately and which to schedule later.
Traditional methods rely on severity scores that often overstate the danger of complex or obscure flaws. The EPSS score introduces a probabilistic layer. It looks at historical data to determine which types of flaws attract attention. This approach acknowledges that not all vulnerabilities are created equal in the eyes of an attacker.
| Stage | What happens | Where it can be stopped |
|---|---|---|
| Feature Extraction | Attributes of the vulnerability are collected and standardised. | Incomplete metadata from CVE Numbering Authorities |
| Model Training | Historical exploit data trains a predictive algorithm. | Biased training data from limited sources |
| Score Generation | A probability value between 0 and 1 is assigned. | Misinterpretation of the decimal output |
Stage 1: Feature Extraction
The process begins with raw data from the Common Vulnerability Enumeration. Each entry contains technical attributes. The system extracts features such as the type of attack required, the complexity of execution, and the privileges needed. These features are standardised to ensure consistency across different software vendors.
Imagine a flaw that requires physical access to a server. The extraction phase notes this high barrier to entry. Another flaw might allow remote code execution with no authentication. The system flags this as highly attractive to attackers. The quality of this data depends on accurate reporting by security researchers.
Stage 2: Model Training
The extracted features feed into a machine learning model. This model has been trained on years of observed exploitation data. It learns which combinations of features correlate with actual attacks. For instance, it might learn that vulnerabilities in widely used web frameworks are exploited more frequently than those in niche industrial protocols.
This training phase is static once the model is published. It does not react to real-time threat intelligence feeds. It relies on historical patterns. This means it is excellent at predicting trends but less effective at predicting brand-new zero-day exploits that have no historical precedent.
Stage 3: Score Generation
The trained model outputs a single decimal number. This number represents the probability of exploitation within the next thirty days. A score of 0.95 means there is a ninety-five per cent chance of exploitation. A score of 0.01 means there is only a one per cent chance. You interpret this as a likelihood, not a guarantee.
This score is independent of the asset it affects. The score for a flaw in a database engine is the same whether that engine runs on a public-facing web server or an isolated internal test machine. Context must be added separately.
Stage 4: Contextual Application
You must apply the EPSS score to your specific environment. A low-probability flaw on a critical internet-facing router is more dangerous than a high-probability flaw on a disconnected backup server. This step transforms statistical likelihood into organisational risk.
This is where risk-based vulnerability management becomes operational. You map the EPSS score to your asset inventory. You identify which systems are exposed to the internet. You identify which systems hold sensitive data. This mapping allows you to triage effectively.
See also: Emergency Patching: How to Fix Critical Flaws Without Breaking Production · Risk-Based Vulnerability Management: Prioritise Exploitability Over CVSS Scores
Stage 5: Prioritisation Logic
Combine the EPSS score with asset criticality to create a prioritisation list. High EPSS scores on high-value assets require immediate action. Low EPSS scores on low-value assets can be deferred. This logic prevents security teams from burning out on theoretical risks.
Consider the trade-off. Ignoring a low-EPSS flaw carries a small risk. Chasing every high-CVSS flaw carries a high operational cost. The goal is to reduce security technical debt by focusing on what matters. You accept a small residual risk to gain significant efficiency gains.
Stage 6: Continuous Review
Vulnerability landscapes change. New exploits emerge. Old ones become obsolete. You must update your EPSS data regularly. The scores are updated monthly to reflect new historical data. Your internal asset inventory also changes. New servers go live. Old ones are retired.
Regular reviews ensure your prioritisation remains accurate. You should not set this process and forget it. Automated tools can help pull the latest EPSS data and re-run your prioritisation logic. This keeps your defence strategy aligned with current threat trends.
Integrating with Other Defences
EPSS is not a standalone solution. It works best when combined with other controls. For example, HTTP security headers can mitigate the impact of certain web vulnerabilities. Dependency updates can remove vulnerable libraries before they are exploited. API vulnerabilities require specific testing that EPSS does not cover directly.
Router vulnerabilities often have low EPSS scores because they are less frequently targeted by automated bots. However, their strategic importance may warrant higher priority. NoSQL injection flaws might have varying EPSS scores depending on the framework used. You must consider the full context.
Limitations and Edge Cases
The EPSS score has limitations. It cannot predict targeted attacks against specific organisations. It assumes attackers behave like historical averages. Advanced persistent threats may ignore statistical likelihoods in favour of strategic value.
It also does not account for compensating controls. A firewall rule might block all traffic to a vulnerable port. The EPSS score does not know this. You must adjust your priority manually if you know such controls are in place. Understanding these limits prevents over-reliance on the metric.
Key takeaways
- EPSS provides a statistical probability of exploitation, distinct from the severity rating provided by the Common Vulnerability Scoring System.
- Combining EPSS with asset context creates a risk-based vulnerability management strategy that reduces alert fatigue.
- Low EPSS scores indicate vulnerabilities that are technically possible but rarely targeted, allowing you to defer patches safely.
The EPSS score predicts exploitation likelihood, not impact severity. Use it to prioritise patches on exposed assets while deferring low-probability flaws on isolated systems.
Frequently asked questions
Does a high EPSS score mean I must patch immediately?
Not necessarily. You must consider asset criticality. A high score on an isolated, unimportant system may still be low priority.
How often are EPSS scores updated?
Scores are updated monthly to incorporate new historical data on exploitation trends.
Can EPSS predict zero-day vulnerabilities?
No. It relies on historical data. It cannot predict exploits for vulnerabilities that have never been seen before.
Is EPSS better than CVSS?
They serve different purposes. CVSS measures severity. EPSS measures likelihood. You need both for a complete picture.
How this guide was produced: written by the Packet Tribune editorial team with AI assistance, checked against the public references listed below, and reviewed when the facts change. See our editorial policy or report an error.